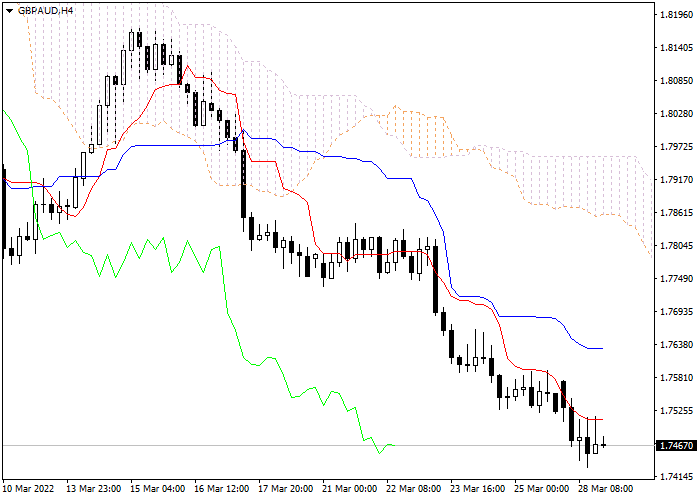
Let's look at the four-hour chart. Tenkan-sen line is below Kijun-sen, the lines are horizontal . Confirmative line Chikou Span is below the price chart, current cloud is descending. The instrument is trading below Tenkan-sen and Kijun-sen lines; the Bearish trend is still strong. One of the previous minimums of Chikou Span line is expected to be a support level (1.7212). The closest resistance level is Kijun-sen line (1.7536).
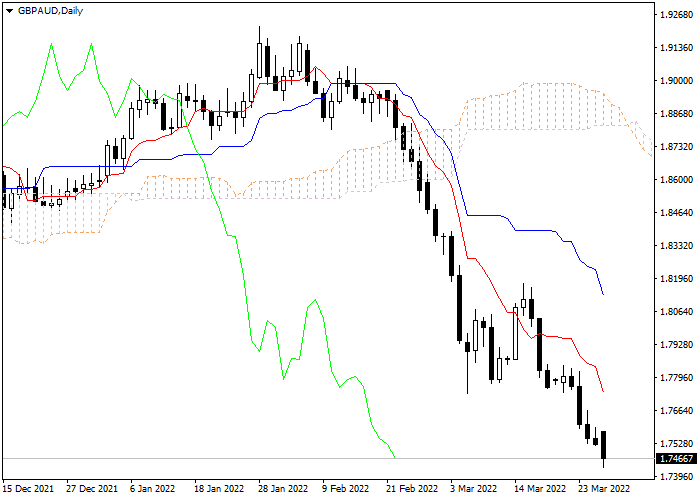
On the daily chart Tenkan-sen line is below Kijun-sen, both lines are directed downwards. Confirmative line Chikou Span is below the price chart, current cloud is descending. The instrument is trading below Tenkan-sen and Kijun-sen lines; the Bearish trend is still strong. One of the previous minimums of Chikou Span line is expected to be a support level (1.7180). The closest resistance level is Tenkan-sen line (1.7731).
On the both charts the instrument is still falling. It is recommended to open short positions at current price with Take Profit at the level of previous minimum of Chikou Span line (1.7212) and Stop Loss at the level of Kijun-sen line (1.7536).
Euro vs Australian Dollar
| Beli | Jual | Spread |
| 1.62475 | 1.62395 | 80 |
Skenario
| Jangka Waktu | Kisaran Hari |
| Rekomendasi | SELL |
| Titik masuk | 1.7468 |
| Take Profit | 1.7212 |
| Stop Loss | 1.7536 |
| Level kunci | 1.7180, 1.7212, 1.7536, 1.7731 |
Skenario alternatif
| Rekomendasi | |
| Titik masuk | |
| Take Profit | |
| Stop Loss | |
| Level kunci |

Materi yang diterbitkan di halaman ini diproduksi oleh Claws&Horns Company bersama dengan LiteFinance dan tidak boleh dianggap sebagai penyediaan nasihat investasi untuk tujuan Arahan 2014/65/UE; selanjutnya, materi ini belum disiapkan sesuai dengan persyaratan hukum yang dirancang untuk mempromosikan independensi penelitian investasi dan tidak tunduk pada larangan apa pun dalam berurusan sebelum penyebaran penelitian tersebut.