
Kalender ekonomi
Kalender ekonomi pada Forex dan berita dunia, disampaikan harian dan mingguan
Forex berita mingguan dan akurat indikator ekonomi dunia kalender dari LiteFinance
Kalender ekonomi adalah alat penting dari trader Forex yang diperbarui secara real time. Kalender ekonomi memberi informasi tentang indikator makro ekonomi yang paling penting dan peristiwa yang mempengaruhi perilaku instrumen perdagangan tertentu. Kalender perekonomian terutama diperlukan bagi mereka para trader yang strategi trading berdasarkan analisa fundamental. Dengan bantuan dari kalender ekonomi, klien LiteFinance akan selalu up to date dengan berita terbaru dan membuat perdagangan mereka di pasar Forex lebih seimbang dan sukses.
Materi yang dipublikasikan di halaman ini disediakan oleh LiteFinance hanya untuk tujuan informasi dan tidak boleh ditafsirkan sebagai saran investasi atau saran untuk tujuan Arahan 2014/65/UE. Selain itu, materi ini belum disiapkan sesuai dengan persyaratan hukum yang dirancang untuk mempromosikan independensi penelitian investasi dan tidak tunduk pada larangan apa pun atas distribusi penelitian investasi lebih lanjut.
Analisis forex dan perkiraan pasar
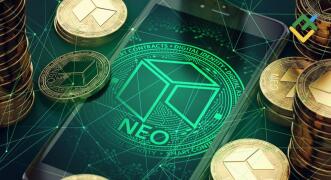

NEO: analisis, prediksi harga, dan potensi investasi. Rencana perdagangan dalam jangka panjang yang...
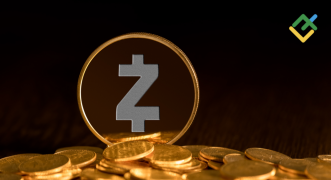
Apakah menguntungkan berinvestasi di ZCash? Baca artikel ini dan temukan cara untuk memperdagangkan...
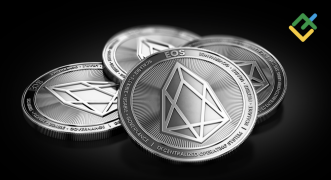
Temukan bagaimana nilai tukar AUSD (EOSUSD) akan berkembang dalam 2026 dan dalam jangka panjang.
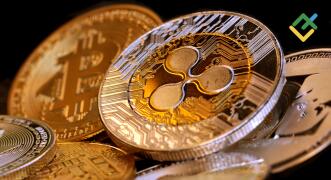
Bagaimana harga Ripple akan berubah hingga 2030? Apakah XRP merupakan investasi yang baik? Temukan j...

Temukan harga Litecoin untuk tahun 2030 dan baca analisis fundamental dan teknisnya untuk tahun 2026...

Bagaimana pasar ETH akan berubah dalam beberapa tahun mendatang? Baca perkiraan kami berdasarkan ana...